- Table of Contents
- 1. Introduction
- 2. SynthBilder Application
- 3. Considerations
- 4. Conclusion
- 5. Related Works and References
1. Introduction
The transformation of an acoustic signal from the time domain into other mathematical representations of that signal is one of the key concepts of digital signal processing. Of these types of transformations, the Fourier transform is one of the most significant. The DFT (Discrete Fourier Transform) takes a discrete time domain signal and breaks it up into discrete frequency bins of magnitude and phase counterparts. This is know as the spectrum.
The Fast Fourier Transform, or FFT, is an optimized version of the DFT for computer systems. Running an FFT over an audio segment of N samples will return an array of (N/2)+1 complex numbers[1]. The real and imaginary parts of these complex numbers make up the magnitudes of cosine and sine waves with frequencies equally spaced between zero and one-half of the sampling rate. However, the addition of a cosine and sine wave at the same frequency is the same as a single cosine wave with different amplitude and shift in phase. This can be stated as such:
		A*cos(x) + B*sin(x) = M*cos(x+ theta)
			where
		M=sqrt(A^2 + B^2) and theta=arctan(B/A).
In this case, A is the real part of the array returned by the FFT and B is the imaginary part.
Inversely, to go from the spectral domain back to the time domain, one only needs to add all of the phasers from the FFT.
		 M[1] * cos( 2 * pi * f[1] * t[] + theta[1]) +
		 M[2] * cos( 2 * pi * f[2] * t[] + theta[2]) +
		 M[3] * cos( 2 * pi * f[3] * t[] + theta[3]) +
			...
		 M[n] * cos( 2 * pi * f[n] * t[] + theta[n])
Another challenge for digital signal processing is windowing. The method for transforming an entire time domain signal of significant length into the spectral domain is to break the signal into equal parts (called windows), and do the FFT over each part. However, windows come in all shapes and sizes and will have a significant impact on the transformations. The simplest of these is a rectangular window. However, others such as the Hanning or Tukey window are also very useful. [2]
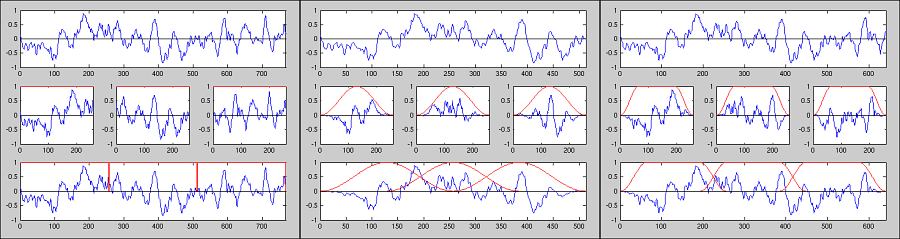
In the figure above you see three separate graphics. In each graphic the orignal signal is split up into 3 windows of equal length. In the middle row of each graph, you see the plot of the 3 signal segments (in blue) after being shaped by the windowing function (in red). The bottom row of each graph shows the final signal after the 3 segments have been put back together, taking overlap into account. Where the segments overlap, the signals are added. For a Hanning window, the overlap is 1/2 the size of the window. A Tukey window, however, can change shapes according to an alpha value. With an alpha of 0, a Tukey window is a rectangle. With and alpha of 1, a Tukey window is a Hanning window. It is therefore a very flexible window. For a Tukey window, the overlap is floor(window_size - alpha*window_size/2).
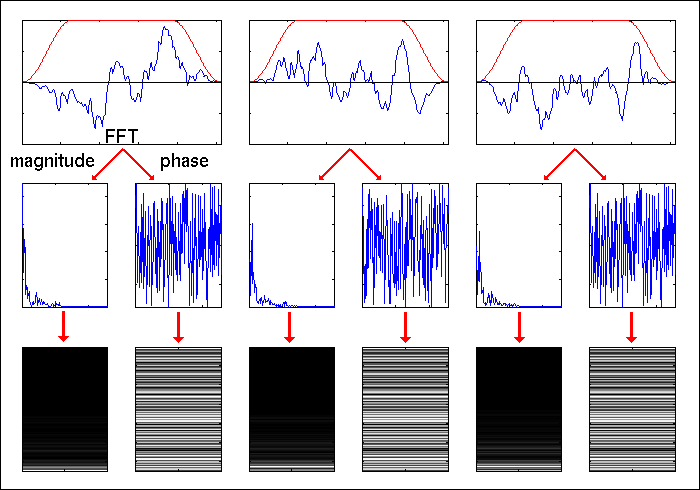
To represent an entire audio clip, FFT's are taken of each windowed segment. As said, the FFT produces an array of real and imaginary parts of complex numbers. In cartesian form, these are the magnitudes of cosine and sine waves, respectively. Conversion to polar form yields magnitude and phase of single cosine signals. In polar form, both arrays of magnitude and phase can be seen either horizontally as a plot of magnitude or phase value over frequency. Or, they can be viewed as vertical columns, or histograms, where the y axis is frequency and the pixel value (brightness) represents the magnitude or phase values. The following figure shows 3 windowed audio segments that have been transformed by an FFT. The second row shows the magnitude and phase of each segment plot horizontally (x=value,y=frequency). The third row shows a histogram of the magnitude and phase (y=frequency, x=1, z=value).
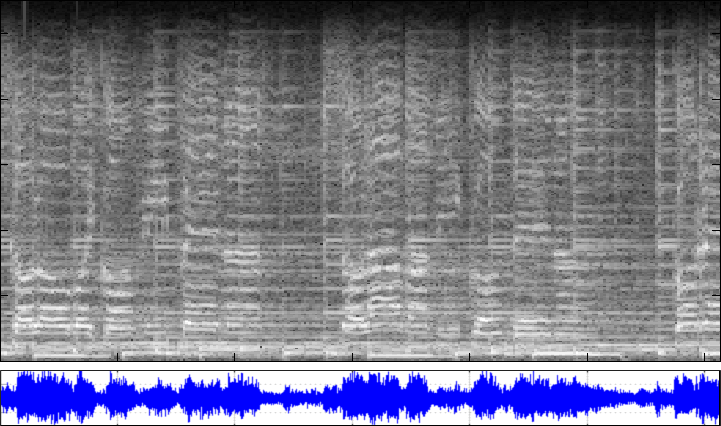
A spectrogram or sonogram is the same as above, only the single histogram columns are concatenated horizontally. Another thing to note is that a spectrogram normally only shows the magnitude portion of a signal. In many ways, a spectrogram is an image of the acoustic signal.